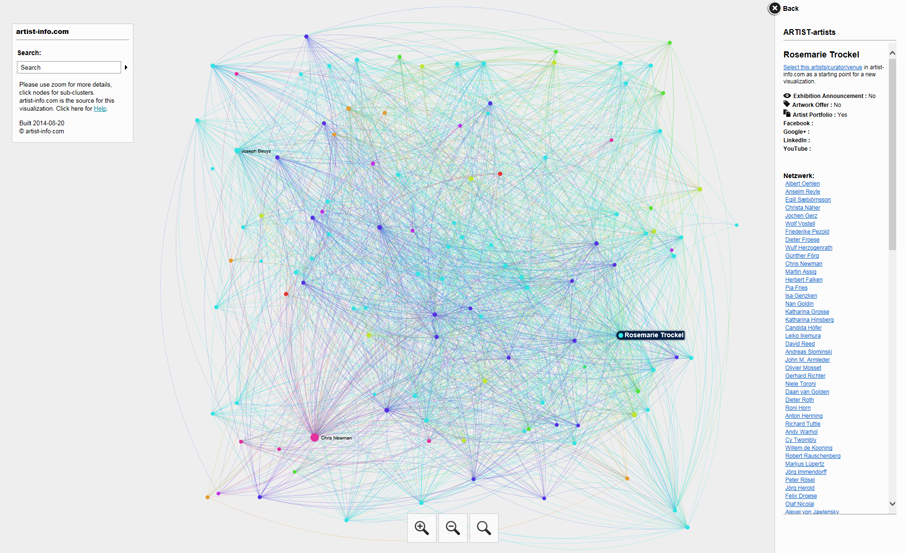
‘Visualizing Art Networks’ page is an introduction to
how this artist-info.com service provides new insight into the world of contemporary art worldwide.
Visually analyzing complex data
artist-info.com is telling new stories
There are exhibitions showing contemporary fine art here and there and at many places worldwide. Some exhibitions are low budget non-profit projects, some are sophisticated shows at commercial places like galleries, and some are high budget international museum exhibits. They are all using this media to show to the public the artist’s artwork related to a specific theme and to further explore our cultural heritage.
The exhibition history is for all, the artist with a biography on solo- und group-exhibitions, the exhibition venue with its program, and the curator an important source for their profile and positioning, their mission and quality. And although their individual branding is existential to them they are all building upon each other’s efforts in some way.
However, retracing geographically and chronologically the exhibition information using a network graph wouldn’t reveal much new insight.
Using Big Data and cross-linking and analyzing all exhibition histories from 1930 up to today on the basis of nomen est omen artist-info.com is offering new insight on a meta level.
Visualizing Art Networks by artist-info is identifying, helping to explore and to develop the valuable connections between artists, curators and exhibition places.
 Visualizing Art Networks
artist-info.com provides for a specific artist, curator, or exhibition place, like a commercial gallery, museum, non-profit place, or collector venue, as the CENTRAL node the following points of view for visualizing their networks, showing how the members of the clusters and sub-clusters are connected with the CENTRAL node and among each other.
 More details on how to best navigate and use all features of the interactive ‘Visualizing Art Networks’ browser windows on our Overview page.
Find on these subpages details and interactive examples which open in a new browser window
for these points of view
 ARTIST ⇔ artists
 ARTIST ⇔ exhibition places
The two complementing views available for an artist are showing how all artists are connected through exhibitions, and how the venues are connected through artists.
 CURATOR ⇔ artists
The view for a specific curator shows the exhibited artists and their connections between each other through exhibitions.
 EXHIBITION PLACE ⇔ artists
 EXHIBITION PLACE ⇔ exhibition places
The two complementing views for an exhibition place show how the venue’s artists are connected between each other, and how the exhibition place is connected through artists with other venues.
 Art Analytics Services
Visualizing Art Networks is one of three services by artist-info which help with new insight to analyse contemporary fine art worldwide.
Artists Exhibition Statistics analysis all exhibition histroy records in artist-info and display the 100 artists with most exhibitions. Details show the number of Solo- and Group-Exhibitions, and the exhibitions number by type of Exhibition Places (Gallery, Museum, Non-Profit, Collector)
Exhibition Records Summary for all artists, curators, galleries, museums, non-profit and collector’s venues is collecting important key numbers from artist-info exhibition records database. The summary provides an important overview on positioning and connections of the artist, curator, or exhibition venue.

