
Overview of artist-info Visualizing Art Networks
Visually analyzing complex
data is telling new stories
The world of contemporary fine art might have many random aspects, but on an upper level the bits and pieces summarize to network structures and clusters. Visually analyzing the links between artists, venues, and curators identifies, helps to explore, and to develop the valuable connections between them.
It is the first time ever a network graph is used to analyze and describe the world of contemporary art with artists, curators, and exhibition places, based on more than 139.000+ artists and 4.900+ curators in 427.600+ shows (1930 – today) in 11.250+ venues in 1.340+ cities in 155 countries in artist-info.com database.
Nomen est omen
‘Visualizing Art Networks’ is based on the exhibition information of artist-info database. The cross-linked exhibition history information of all artists, galleries, museums, non-profit-places and collector venues as well as curators is used to create the network graphs. This network analysis is therefore based on the artist’s name – Nomen est omen – and not on specific art works exhibited.
Visual Analytics
Using network graphs as a tool for analyzing complex data is used in many industries already on a ‘Analytics 3.0’ level, combining the best of 1.0 and 2.0, combining all sources of data, embedding analytics throughout organizations, greater use of visual analytics to simplify complex data and tell stories numbers and text hardly could tell.
In the world of contemporary fine art artists, exhibition venues, and curators publish with some times more, some times less details of their solo- and group-exhibitions to inform about their profile. Although their individual branding is existential to them they are all building upon each other’s efforts in some way. artist-info is cross-linking all this information and uses it as source for ‘Visualizing Art Networks’: Lists and tables of names never could tell how all this information is connected and that there are structures, not visible without visualizing this data.
The network clusters are telling compelling stories, are exploring relations, and are developing valuable connections.
5 Points of View
artist-info provides 5 points of view, each on an individual, interactive webpage, which are described on the following subpages
 ARTIST ⇔ artists
ARTIST ⇔ exhibition venues
The two complementing views available for an artist are showing how all artists are connected through exhibitions, and how the venues are connected through artists.
CURATOR ⇔ artists
The view for a specific curator shows the exhibited artists and their connections between each other through exhibitions.
EXHIBITION VENUE ⇔ artists
EXHIBITION VENUE ⇔ exhibition venues
The two complementing views for an exhibition place (gallery, museum, non-profit place, or collector venue) show how the venue’s artists are connected between each other, and how the exhibition place is connected through artists with other venues.
How to Navigate Visualizing Art Networks Webpage
Each ‘Visualizing Art Networks’ point of view webpage has an individual URL and opens in an individual browser window.
The URL can therefore be used as a web-link wherever web-links can be built-in.
 Zoom In, Out / Reset | Use at the bottom of the network graph window +, -, or o to zoom in, zoom out, or go back to start image of the network graph, or use alternatively the mouse wheel. Zooming in makes the dot / node names appear. |
‘Mouse-over’ of the dots / nodes of the network graph shows the name of the node, e.g. the artist’s or the venue’s name.
Clicking the dot / node filters the network graph so show the sub-cluster build by the CENTER node and the clicked node together with all related sub-cluster members.
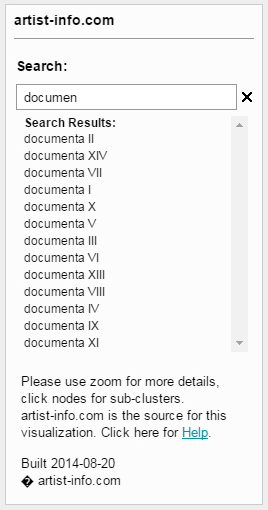 Left Side Pane | The left side pane offers a search field to search all members of the 'Visualizing Art Networks' point of view. Selecting the search result has the same effect as clicking the related network dot / node. Alternatively a network member can be selected from the list in the right side pane. The 'Help'-link opens artist-info.com Help-Page. Built date informs about the date when the 'Visualizing Art Networks network graph was built. |
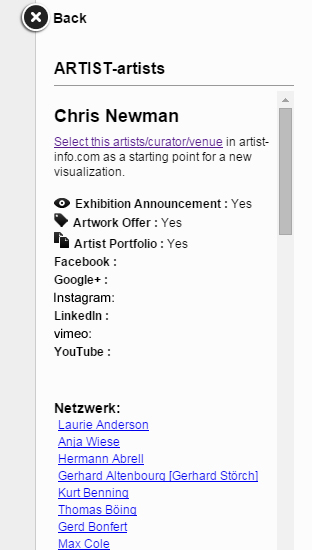 Right Side Pane | The right side pane title is the 'Visualizing Art Networks' point of view name: ARTIST-artists, ARTIST-exhibition venues, CURATOR-artists, VENUE-artists, VENUE-exhibition venues. The name of the selected network member, the dot / node, is displayed underneath the title. It was selected either by clicking on a dot / node, or by using the search field in the left side pane. (Back) at the top serves as reset button restoring the unfiltered network graph with all network members. 'Select this artist / curator / venue'-link opens in a new browser tab the related artist-info.com page with the  exhibition history, exhibition history,  Exhibition Announcements, Exhibition Announcements,  Artwork Offers, or Artwork Offers, or  Artist-Portfolio in case available. Artist-Portfolio in case available.The availability is either Yes or No. In case artist-info knows Community Channel links for the artist, curator, or exhibition venue a direct link is provided for the  Facebook, Facebook,  Instagram, Instagram,  LinkedIn, LinkedIn, vimeo, and vimeo, and  YouTube account. YouTube account.Next the list of the cluster's network members is displayed. It serves as overview and filters by clicking on the members name the same way as clicking on the network dot / node. |