All posts filed under: Analytics

Thomas Walther Collection Artists Today

Analytics / Artists / Collectors / Galleries / History / Musuems / Network Visualization / Non-Profit Venues / Projects
Thomas Walther Collection

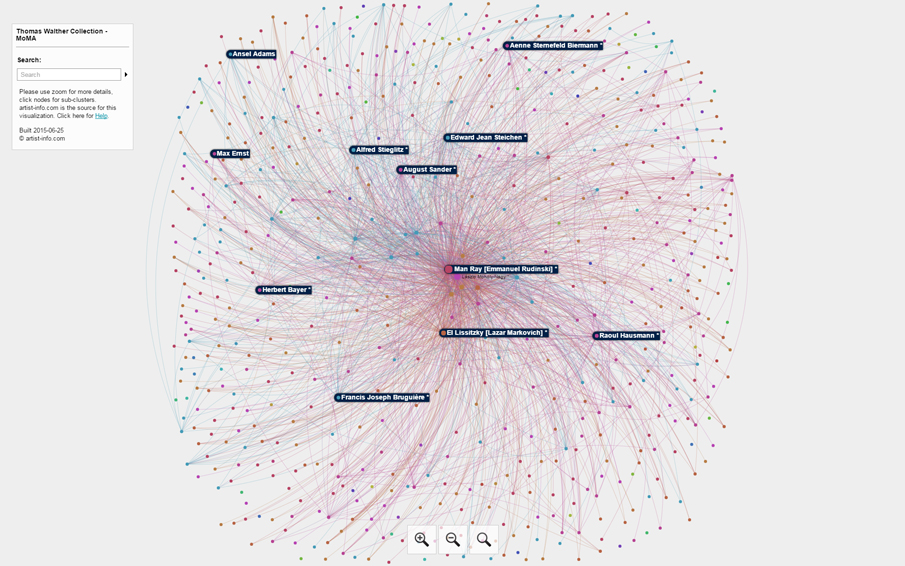
147 artists of the Thomas Walther Collection. Our networkgraph shows how the artists are connected through exhibitions.  Click here to open a browser window with the Thomas Walther Collection Artist network visualization. The Thomas Walther Collection Artists Today The MoMA ‘Thomas Walther Collection’ Exhibition   After four years of research and conservation initiative the MoMA, New York, was showing from December 13, 2104 – April 19, 2015 the work of 147 artists in Modern Photographs from […]

Exhibition History Summary

Analytics / Artists / Collectors / Curators / Galleries / Musuems / Non-Profit Venues / Research

Exhibition History Provides Important Insight “You do not need to be a millionaire to access high quality but you do need to put a bit of time and effort into your own research or gaining access to some objective advice.” Clare McAndrew, artseconomics.com   Studying an artist’s work, reading an art critic’s opinion, and looking at recent as well as older artwork to understand how perspectives and point of views do change is important.   All your […]

Overview of artist-info Visualizing Art Networks

Analytics / Artists / Collectors / Curators / Galleries / Musuems / Non-Profit Venues / Overview / Research

Overview of artist-info Visualizing Art Networks Visually analyzing complex data is telling new stories The world of contemporary fine art might have many random aspects, but on an upper level the bits and pieces summarize to network structures and clusters. Visually analyzing the links between artists, venues, and curators identifies, helps to explore, and to develop the valuable connections between them. It is the first time ever a network graph is used to analyze and […]

VENUE-venues Networks visualized

Analytics / Collectors / Exhibition Venues / Galleries / Musuems / Network Visualization / Non-Profit Venues / Research

To open this example of visualizing a VENUE-venues network in a new browser window click on the image or here. Find on our Overview page details on how to best navigate and use all features of the interactive ‘Visualizing Art Networks’ browser windows. Visualizing Art Networks – VENUE-venues Example This VENUE-venues example for ‘Visualizing Art Networks’ is about Gallery Maureen Paley, London, and the exhibition places where the same artists were shown. All artists, the […]

VENUE-artists Networks visualized

Analytics / Artists / Collectors / Exhibition Venues / Galleries / Musuems / Network Visualization / Non-Profit Venues / Research

To open this example of visualizing a VENUE-artists network in a new browser window click on the image or here. Find on our Overview page details on how to best navigate and use all features of the interactive ‘Visualizing Art Networks’ browser windows. Visualizing Art Networks – VENUE-artists Example This VENUE-artists example for ‘Visualizing Art Networks’ is about Gallery Maureen Paley and the artists the gallery has selected for exhibitions. All artists and their exhibitions […]

CURATOR-artists Networks visualized

Analytics / Artists / Curators / Network Visualization / Research

To open this example of visualizing a CURATOR-artists network in a new browser window click on the image or here. Find on our Overview page details on how to best navigate and use all features of the interactive ‘Visualizing Art Networks’ browser windows. Visualizing Art Networks – CURATOR-artists Example This CURATOR-artists example for ‘Visualizing Art Networks’ is about curator Klaus Biesenbach and the artists he has selected for some of his shows. All related exhibitions […]

ARTIST-artists Networks visualized

Analytics / Artists / Research

To open this example of visualizing an ARTIST-artists network in a new browser window click on the image or here. Find on our Overview page details on how to best navigate and use all features of the interactive ‘Visualizing Art Networks’ browser windows. Visualizing Art Networks – ARTIST-artists Example This ARTIST-artists example is about the artist Chris Newman and the artists he was connected with through showing their artwork together. All related exhibitions for this […]

ARTIST-venues Networks visualized

Analytics / Artists / Collectors / Galleries / Musuems / Network Visualization / Non-Profit Venues / Research

To open this example of visualizing an ARTIST-venues network in a new browser window click on the image or here. Find on our Overview page details on how to best navigate and use all features of the interactive ‘Visualizing Art Networks’ browser windows. Visualizing Art Networks – ARTIST-venues Example This ARTIST-venues example is about the artist Chris Newman and the venues his work was shown. All related exhibitions and exhibition places for this insight can […]

Artist Exhibition Statistics

Analytics / Artists / Exhibition Statistics / Research

All 100 artists with the highest number of exhbitions are listed with details on artist-info Artist Exhibition Statistics page. Top 100 Artists Exhibition Statistics Auction price statistics only offer a very limited insight into the world of contemporary arts. Since many decades exhibitions are playing a key role in each artist‘s biography as well as for exhibition places, worldwide. So far, statistics on the artist’s exhibitions worldwide haven’t been available. Based on more than 410.600 […]