All posts filed under: Network Visualization

Thomas Walther Collection Artists Today

Analytics / Artists / Collectors / Galleries / History / Musuems / Network Visualization / Non-Profit Venues / Projects
Thomas Walther Collection

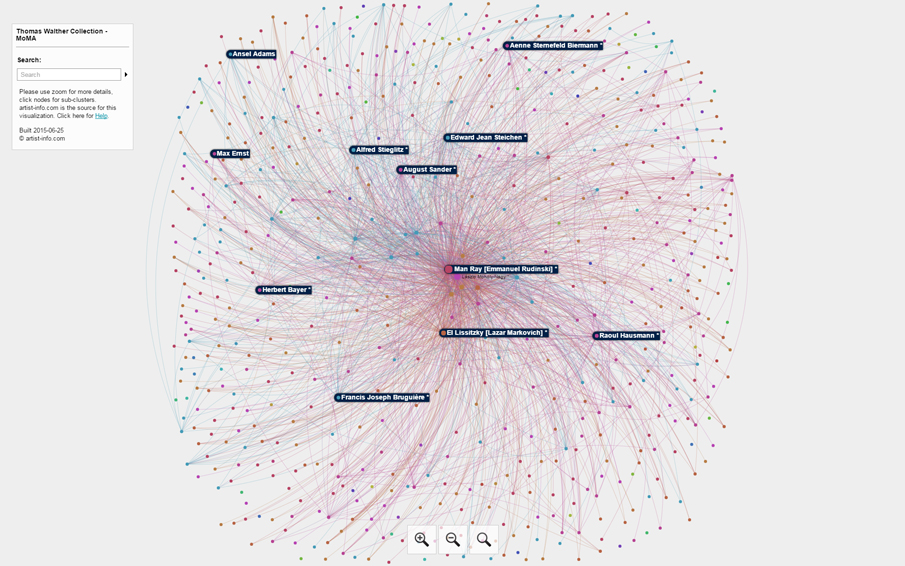
147 artists of the Thomas Walther Collection. Our networkgraph shows how the artists are connected through exhibitions.  Click here to open a browser window with the Thomas Walther Collection Artist network visualization. The Thomas Walther Collection Artists Today The MoMA ‘Thomas Walther Collection’ Exhibition   After four years of research and conservation initiative the MoMA, New York, was showing from December 13, 2104 – April 19, 2015 the work of 147 artists in Modern Photographs from […]

VENUE-venues Networks visualized

Analytics / Collectors / Exhibition Venues / Galleries / Musuems / Network Visualization / Non-Profit Venues / Research

To open this example of visualizing a VENUE-venues network in a new browser window click on the image or here. Find on our Overview page details on how to best navigate and use all features of the interactive ‘Visualizing Art Networks’ browser windows. Visualizing Art Networks – VENUE-venues Example This VENUE-venues example for ‘Visualizing Art Networks’ is about Gallery Maureen Paley, London, and the exhibition places where the same artists were shown. All artists, the […]

VENUE-artists Networks visualized

Analytics / Artists / Collectors / Exhibition Venues / Galleries / Musuems / Network Visualization / Non-Profit Venues / Research

To open this example of visualizing a VENUE-artists network in a new browser window click on the image or here. Find on our Overview page details on how to best navigate and use all features of the interactive ‘Visualizing Art Networks’ browser windows. Visualizing Art Networks – VENUE-artists Example This VENUE-artists example for ‘Visualizing Art Networks’ is about Gallery Maureen Paley and the artists the gallery has selected for exhibitions. All artists and their exhibitions […]

CURATOR-artists Networks visualized

Analytics / Artists / Curators / Network Visualization / Research

To open this example of visualizing a CURATOR-artists network in a new browser window click on the image or here. Find on our Overview page details on how to best navigate and use all features of the interactive ‘Visualizing Art Networks’ browser windows. Visualizing Art Networks – CURATOR-artists Example This CURATOR-artists example for ‘Visualizing Art Networks’ is about curator Klaus Biesenbach and the artists he has selected for some of his shows. All related exhibitions […]

ARTIST-venues Networks visualized

Analytics / Artists / Collectors / Galleries / Musuems / Network Visualization / Non-Profit Venues / Research

To open this example of visualizing an ARTIST-venues network in a new browser window click on the image or here. Find on our Overview page details on how to best navigate and use all features of the interactive ‘Visualizing Art Networks’ browser windows. Visualizing Art Networks – ARTIST-venues Example This ARTIST-venues example is about the artist Chris Newman and the venues his work was shown. All related exhibitions and exhibition places for this insight can […]