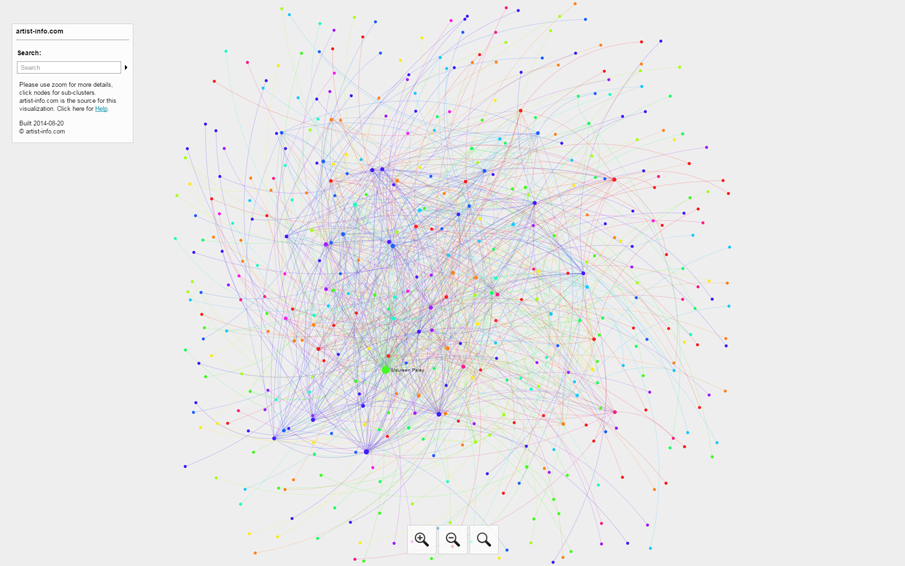
To open this example of visualizing a VENUE-artists network in a new browser window click on the image or here.
Find on our Overview page details on how to best navigate and use all features of the interactive ‘Visualizing Art Networks’ browser windows.
Visualizing Art Networks – VENUE-artists Example
This VENUE-artists example for ‘Visualizing Art Networks’ is about Gallery Maureen Paley and the artists the gallery has selected for exhibitions. All artists and their exhibitions for this insight can be found on Gallery Maureen Paley’s artist-info page.
This VENUE-artists point of view is complemented by our VENUE-venues point of view. It shows all exhibition places to which all the venue’s artists are connected.
Below artist-info ‘Visualizing Art Networks’ shows how the artists are connected through exhibitions among each other in clusters and sub-clusters.
They are summarized at the bottom of the page with Benefits.
How to read the visualized networks
CENTER – In this example the center of the visualized networks is Gallery Maureen Paley and all queries of artist-info database for the visualized networks are related to this gallery.
For Gallery Maureen Paley artist-info knows of 88 artists whose artwork was exhibited from 1984 – 2015 in 143 exhibitions.
BEFORE / after – An exhibition place’s exhibition history gives you hopefully a list of these exhibitions and for each exhibition the artists, and curators. It is important information for the profile of the venue. Exhibitions are the most important media to show the artist’s work to the public and communicate the focus the venue attends to address, to attract new visitors or clients, physically or virtually.
before / AFTER – All 88 artists are listed in the right side pane by clicking on ‘Gallery Maureen Paley’ in the network heap. The different colors help to identify groups of artists who are connected through exhibitions at other venues the artist-info database knows. By selecting an artist the displayed cluster is showing these groups. The cluster’s different colors are related to the number of connecting edges.
Other than a venue’s ordinary exhibition history the artist’s and the venue’s cross-linked exhibition histories on artist-info, including curators, gives you the possibility to look up each exhibition with the participating artists and the exhibition venues with their exhibition history, and curators.
The search option on the left helps to find a specific artist among all 88 artists. The search result is listed in the right side pane. Details on how to use the right side pane can be found on our Overview page.
CLUSTERS / SUB-CLUSTERS – Zooming in and selecting with your mouse an artist unfolds the important capacity and value of artist-info ‘Visualizing Art Networks’.
You will find different groups of artists building clusters with the CENTER, Gallery Maureen Paley. The clusters are showing not only the relation between Gallery Maureen Paley and each of the cluster’s artists but as well how the members of the cluster are connected among each other, one more, some less, showing their dominance (shade of color) through the known details like the number of times showing together and the number of edges with other network members.
The list of the cluster’s artists in the right side pane helps to further select sub-clusters, identifying (e.g. mouse over), further filtering, and selecting, exploring, discovering, evaluating artists in the network. More on our Overview page.
PROPAGATION – How to find options for new connections?
The big heap of the starting image is surrounded by single dots at the end of a line / edge. These single dots represent artists who are most likely important new associations for the CENTER exhibition place as a result of the artist-info algorithm. They have the highest number of exhibitions with the related network cluster member but not directly with the CENTER exhibition place, Gallery Maureen Paley.
To go back to the starting image click on ‘Maureen Paley’ and then on ‘Back’ at top of the right side pane.
It is the first time these amazing relations can be shown and no list or table could give you this overview and insight.

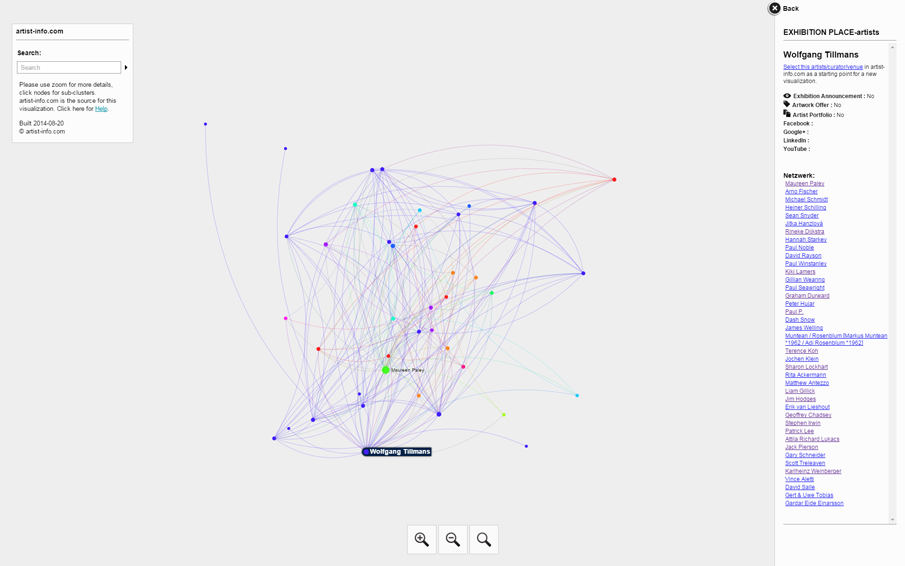
Selecting Wolfgang Tillmans from the list of artists shown in exhibitions of Gallery Maureen Paley displays all artists Wolfgang Tillmans is connected to through other exhibitions.
The blue color of the edges shows the highest number of these connections. It shows like the other artists with blue network graph the importance of Wolfgang Tillmans in relation to all other artists in exhibitions of Gallery Maureen Paley.
All exhibitions of Wolfgang Tillmans in artist-info database and his many more connections show his artist-info page.

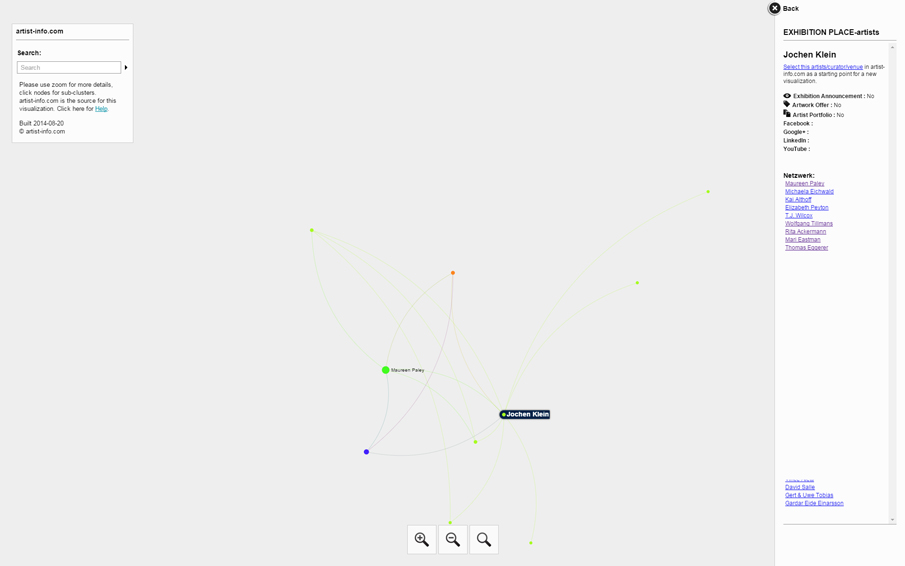
In contrary to Wolfgang Tillmans the artist Jochen Klein with a network graph in green color has very few connections to other artists in exhibitions of Gallery Maureen Paley.
All exhibitions of Jochen Klein in artist-info database and his many more connections shows his artist-info page.
Benefits
This VENUE-artists insight can be created for each of the 11.255+ exhibition venues (gallery, museum, non-profit place, and collector) in 1.342+ cities in 155 countries in artist-info database.
 VENUE PROFILE – The profile of an exhibition place, whether it is a commercial gallery, a museum, a non-profit place, or a collector venue, is very much related to its exhibition program and the exhibited artists. It helps very much to communicate the intended quality and to attract visitors or clients.
Other than a list of artist shown or the list of exhibitions organized during a certain period ‘Visualizing Art Networks’ reveals how the artists are connected among each other and how the clusters contribute to the mission the exhibition place is focusing on.
 SUPPORT – The visualized networks can help to develop valuable connections now visible through the network graph.
 GET INSPIRED – Showing the other artists in the neighborhood and the way they are connected to the CENTER is an important source for possible new exhibitions.
Second important information for new associations is the artists selected by artist-info’s propagation algorithm and displayed as single points around the basic network image.
 NEW ASSOCIATIONS – The big heap of the starting image is surrounded by single dots at the end of a line / edge. These single dots represent artists who are most likely important new associations for the CENTER venue. They have the most exhibitions with a network cluster member but are not yet directly connected with the CENTER venue.
To go back to the starting image click on ‘Gallery Maureen Paley’ and then on ‘Back’ at top of the right side pane.
Support
More details and how to use or customize Visualizing Art Networks for your project can be found on artist-info Help page / VISUALIZATION.

